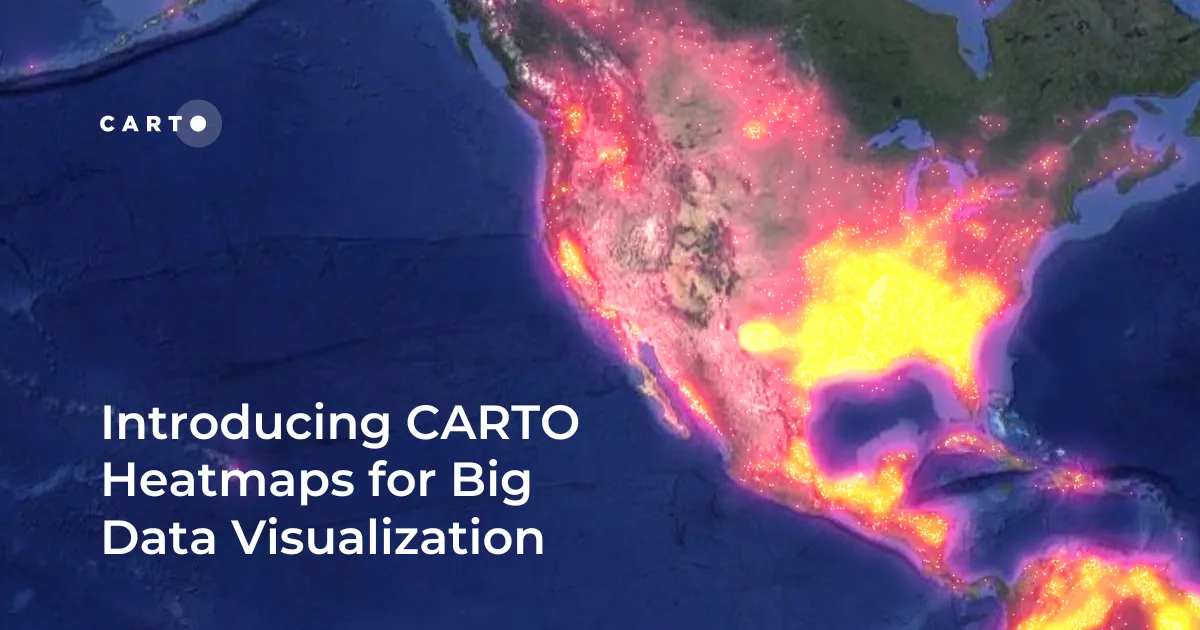
CARTO Helen McKenzie · Jul 4, 2024Introducing CARTO Heatmaps for Big Data VisualizationEnhance your big data visualization with CARTO's heatmap style! Learn how to impactful, large-scale heatmaps with this guide.Cartography & Visualization
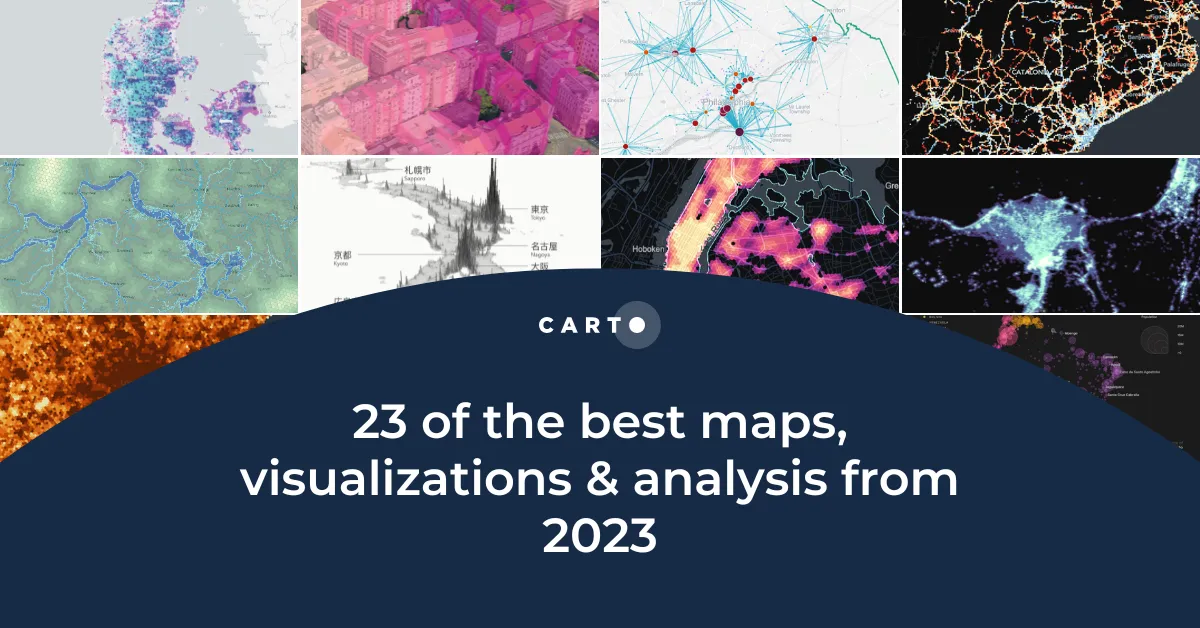
CARTO Helen McKenzie · Dec 19, 202323 of the best maps, visualizations & analysis from 2023Explore 23 of the best maps and visualizations of 2023. From advanced analytics to awesome visualizations with huge geospatial data.Cartography & Visualization
CARTO Helen McKenzie · Nov 16, 2023Pie Charts: An Effective Data Visualization Tool?A guide to creating Pie Charts for effective spatial Data Visualization & dashboards, including best practice and examples.Cartography & Visualization
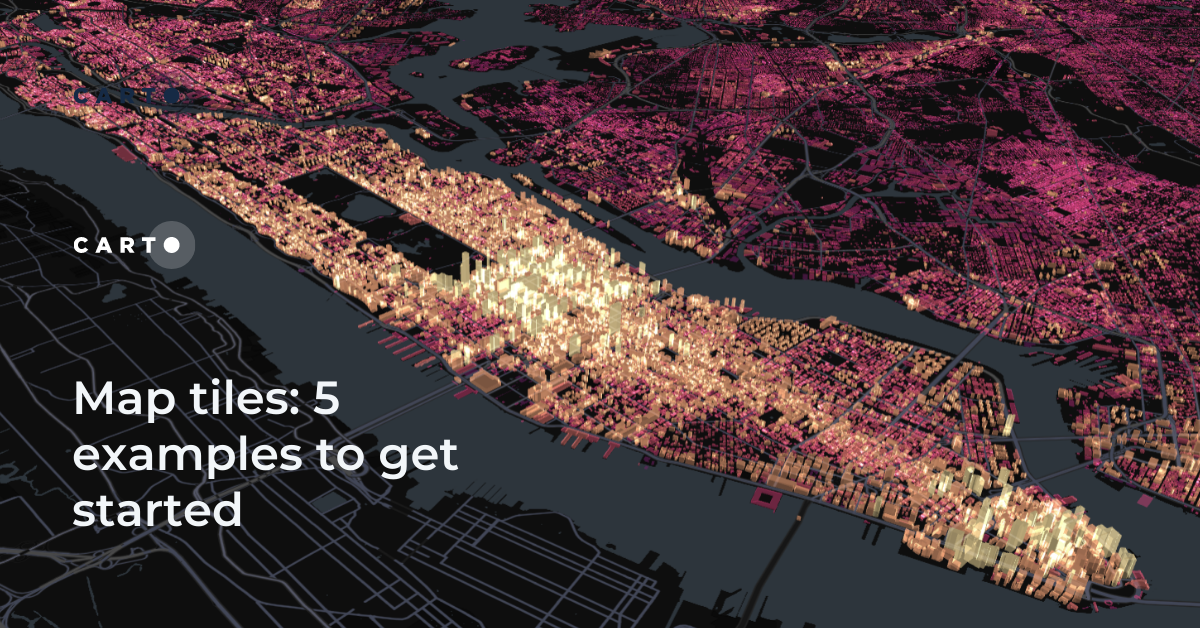
CARTO Helen McKenzie · Jul 13, 2023Map tiles: 5 examples to get startedLearn how to effectively visualize geospatial data with tilesets, including a step-by-step guide and 5 examples to inspire you!Cartography & Visualization
CARTO Alberto Asuero · May 11, 2023Power 3D Maps with Google Maps Platform, CARTO & deck.glLearn how to leverage photorealistic 3D map tiles with this collaboration from Google Maps Platform, CARTO, and deck.gl.Cartography & Visualization
CARTO Helen McKenzie · Mar 1, 20235 maps you didn't know you could create with SQLDid you know you can use Spatial SQL to create amazing maps and data visualizations? Learn how with these five examples.Cartography & Visualization
CARTO Matt Forrest · Jan 23, 2023Map Tiles: Everything You Need To KnowAn introduction to map tiles: a method for visualizing big spatial data, including a guide for generating map tiles with Spatial SQL.Cartography & Visualization
CARTO Helen McKenzie · Dec 19, 202222 of the best maps, visualizations & analysis from 2022A round-up of some of our favorite pieces of analysis, maps and visualizations using CARTO from 2022 in areas including retail, transport, climate & more!Cartography & Visualization
CARTO Helen McKenzie · Aug 12, 2022How to create Google Street View pop-ups with CARTOCARTO's guide to using Google Street View images in your map pop-ups.Cartography & Visualization
CARTO CARTO Contributors · Jun 25, 2021How to Visualize Urban Growth with Spatial Analytics in BigQueryHow has your city or urban area grown? Discover how to create an Urban Growth visualization using open data & CARTO's Spatial Analytics in BigQuery.Cartography & Visualization